 Our Excel addin software displays cell formulae as mathematical equations. This innovative cell formula verification tool turns Excel into an engineer's calculation pad. It is essential for all engineers, teachers and students. It works with Excel 2000, 2003, 2007, 2010, 2013 and 2016.
 Our Calcs are template Excel solutions covering many subjects including Strength, Beams, Buckling, Civil Engineering, Cracks, Finite Element, Frames, Materials, Plates, Stress Concentration, Structural Details, Torsion, Pressure Vessels, Machine Design, Bolts and Threads, Gears, Pins and Joints, Ropes and Cables, Shafts, Welds, Math, Geometry, Heat Transfer (Conduction, Convection, Radiation & Combined), Dynamics, Fluids Mechanics, Piping, Electricity and Finance.

When you add a trendline to a chart, Excel provides an option to display the trendline equation in the chart. This tip describes how to create formulas that generate the trendline coefficients. You can then use these formulas to calculate predicted y values for give values of x.
1) First the Easy Way
These videos are best viewed in full screen mode. Press play and double click the screen to maximise.
2) Now the More Complex 'Dynamic' Way
These videos are best viewed in full screen mode. Press play and double click the screen to maximise.
Linear Trendline
Equation: y = m * x + b
m: =SLOPE(C8:H8,C5:H5)
b: =INTERCEPT(C8:H8,C5:H5)
Logarithmic Trendline
Equation: y = (c * LN(x)) + b
c: =INDEX(LINEST(C8:H8,LN(C5:H5)),1)
b: =INDEX(LINEST(C8:H8,LN(C5:H5)),1,2)
Power Trendline
Equation: y=c*x^b
c: =EXP(INDEX(LINEST(LN(C8:H8),LN(C5:H5),,),1,2))
b: =INDEX(LINEST(LN(C8:H8),LN(C5:H5),,),1)
Exponential Trendline
Equation: y = c *e ^(b * x)
c: =EC5:H5P(INDEX(LINEST(LN(C8:H8),C5:H5),1,2))
b: =INDEX(LINEST(LN(C8:H8),C5:H5),1)
2nd Order Polynomial Trendline
Equation: y = (c2 * x^2) + (c1 * x ^1) + b
c2: =INDEX(LINEST(C8:H8,C5:H5^{1,2}),1)
C1: =INDEX(LINEST(C8:H8,C5:H5^{1,2}),1,2)
b = =INDEX(LINEST(C8:H8,C5:H5^{1,2}),1,3)
3rd Order Polynomial Trendline
Equation: y = (c3 * x^3) + (c2 * x^2) + (c1 * x^1) + b
c3: =INDEX(LINEST(C8:H8,C5:H5^{1,2,3}),1)
c2: =INDEX(LINEST(C8:H8,C5:H5^{1,2,3}),1,2)
C1: =INDEX(LINEST(C8:H8,C5:H5^{1,2,3}),1,3)
b: =INDEX(LINEST(C8:H8,C5:H5^{1,2,3}),1,4)
Higher Order Polynomial Trendline
Follow the pattern set in the second and third order polynomial trendlines.
In the Forum
Read MajorMagee's comments and example spreadsheet.
Some Sample Calculations on the Site
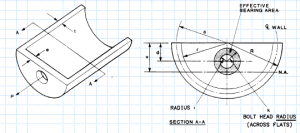
Purpose of calculation: Calculate stress in a 'semi circular' tension fitting (or bath tub fitting).
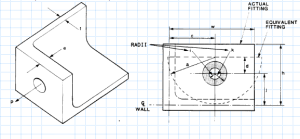
Purpose of calculation: Calculate stress in a 'angle' tension fitting...
 Channel type tension fitting.xls
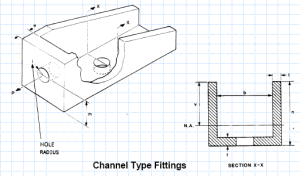
Purpose of calculation: Calculate stress in a 'channel' tension fitting...