Soil Gradation Plot
Description
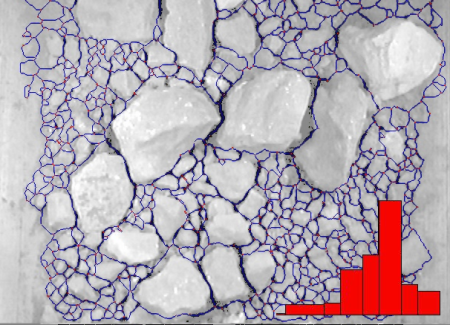
Soil gradation is an important aspect of soil characterization that represents the distribution of different particle sizes in a soil sample. Plotting soil gradation involves using the results of a sieve analysis, which is a laboratory test that separates soil particles based on their sizes by passing the sample through a series of sieves with varying opening sizes. Here's a summary of how to plot soil gradation based on the percent passing various sieve sizes:
-
Sample Collection: Collect a representative soil sample from the site for sieve analysis. The sample should be air-dried and free of organic matter, debris, or other contaminants.
-
Sieve Analysis: Perform the sieve analysis by placing the soil sample on the top sieve of a stack with progressively smaller openings (usually following a standard sieve series). Shake the stack of sieves using a mechanical sieve shaker or by hand, allowing soil particles to pass through the sieves based on their sizes.
-
Weigh Fractions: After the sieving process, weigh the soil retained on each sieve and the soil passing the finest sieve. Record the weight of the soil fractions.
-
Calculate Percent Passing: Divide the weight of soil passing each sieve by the total weight of the soil sample and multiply by 100 to obtain the percent passing for each sieve size. Calculate the cumulative percent passing by starting with the largest sieve size and adding the percent passing for each smaller sieve size.
-
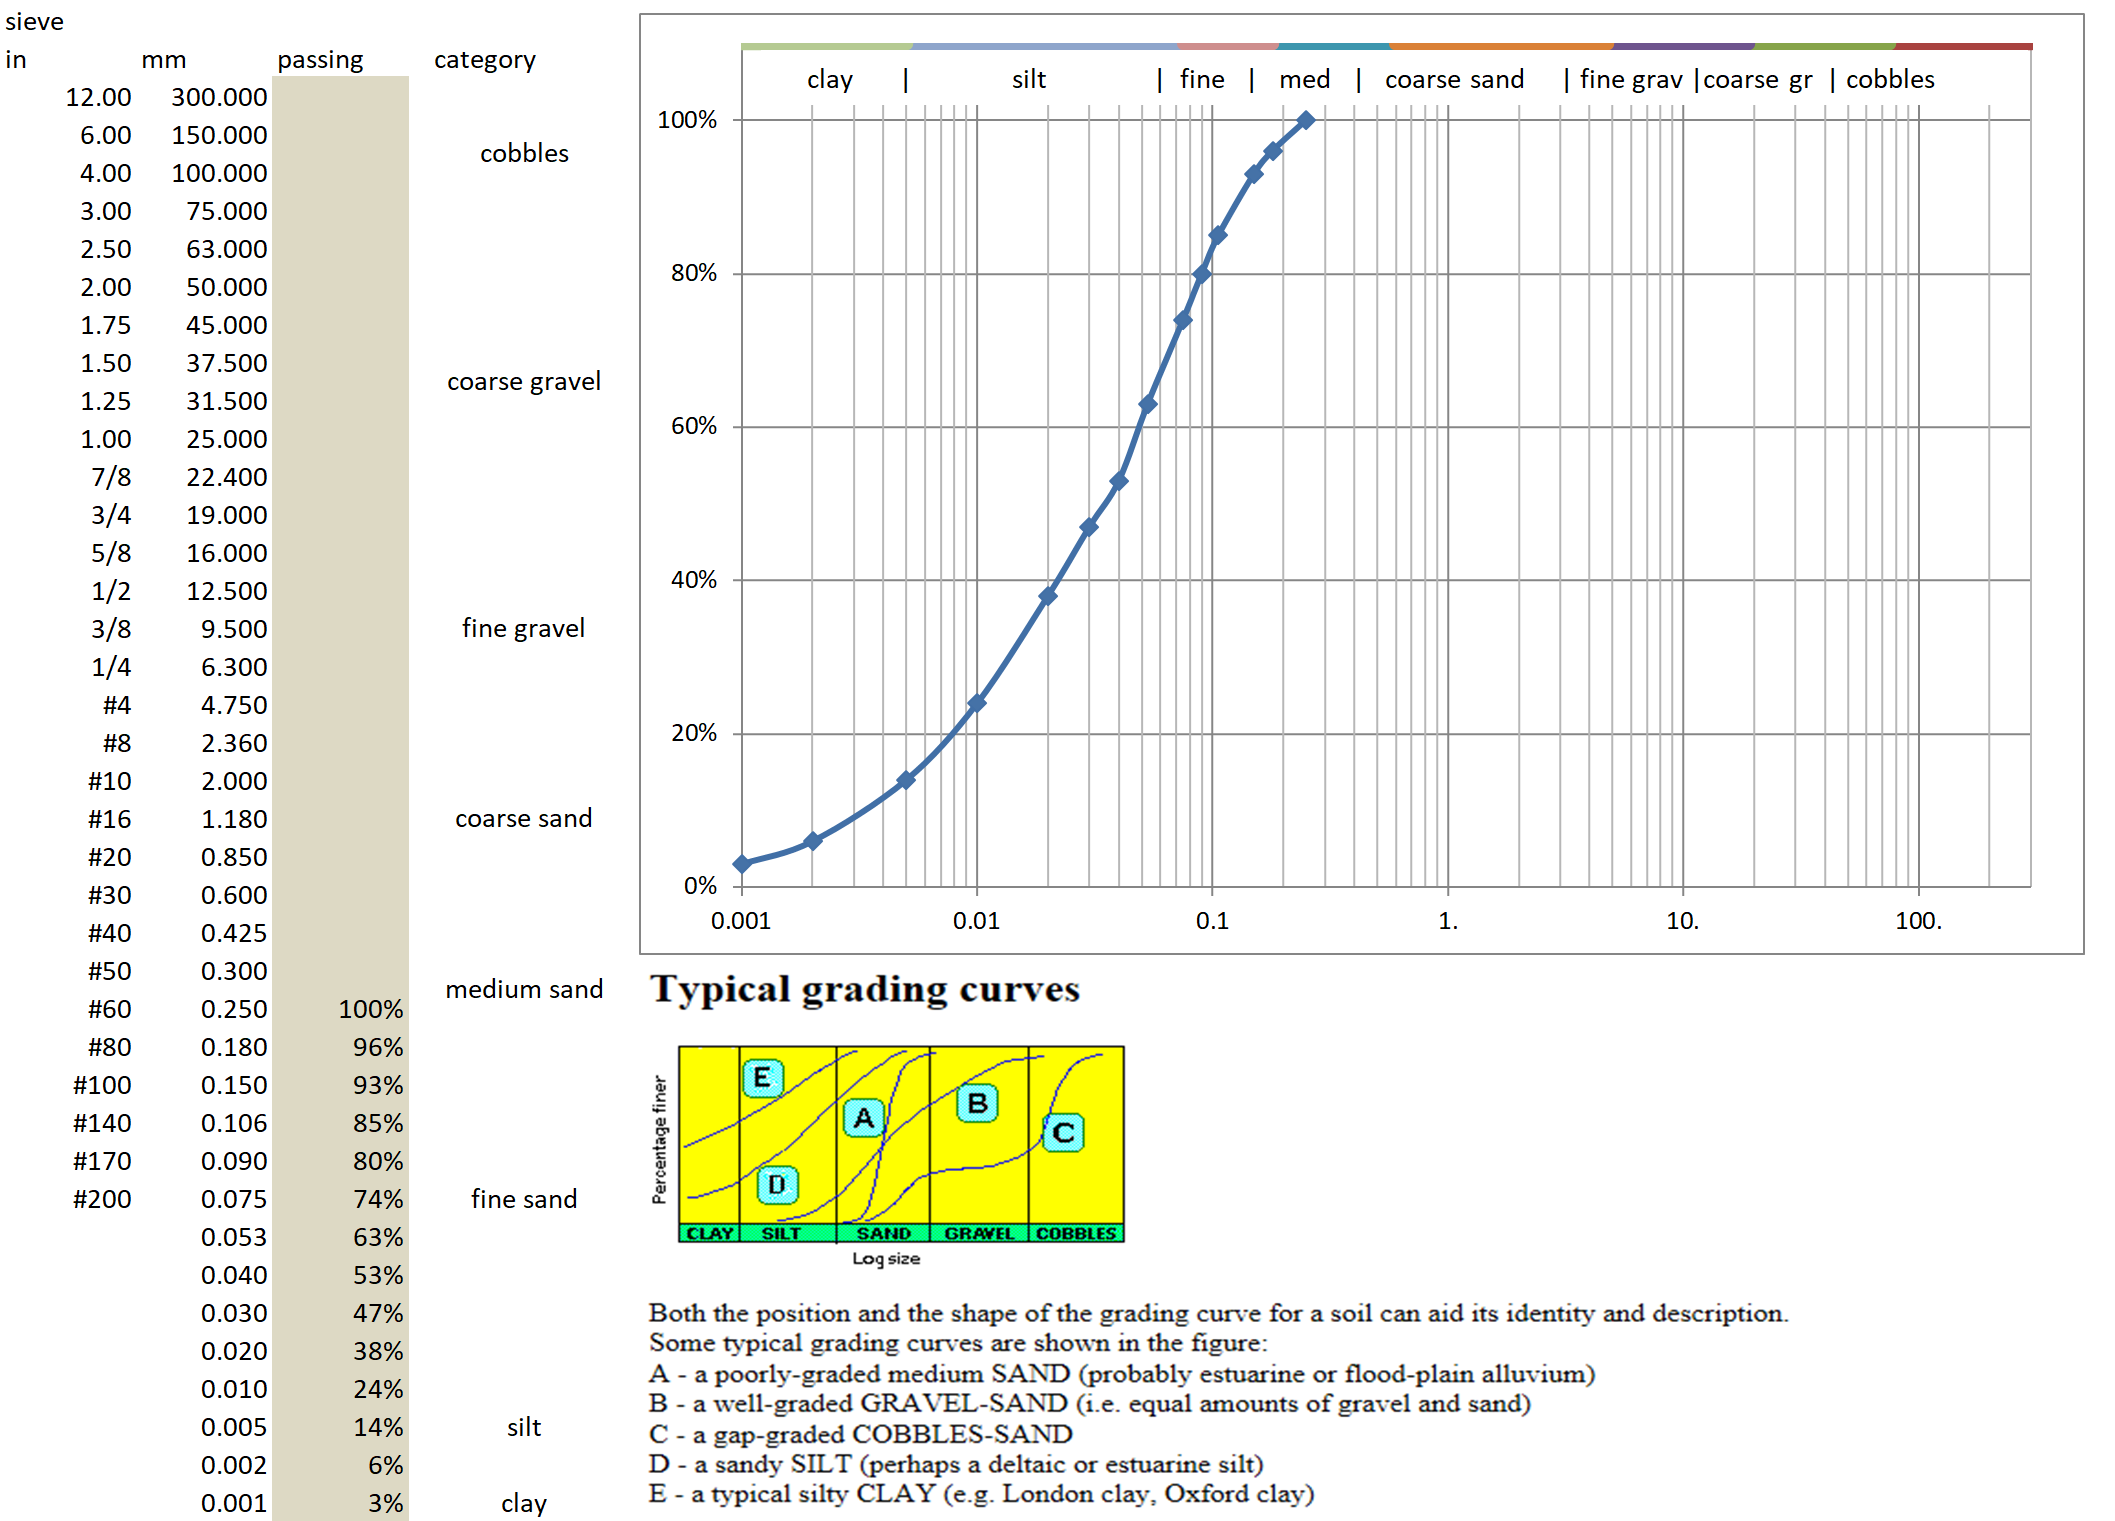
Plot Gradation Curve: Create a semi-logarithmic graph, with the sieve sizes (in millimeters) plotted on the x-axis using a logarithmic scale and the percent passing on the y-axis using a linear scale. Plot the cumulative percent passing for each sieve size as data points and connect the points with a smooth curve. This curve is known as the gradation curve.
-
Interpret Gradation Curve: Analyze the gradation curve to classify the soil according to its particle size distribution. The curve's shape and slope can help determine whether the soil is well-graded (having a wide range of particle sizes), poorly-graded (uniform or narrowly graded), or gap-graded (missing certain particle size ranges).
In summary, plotting soil gradation involves collecting a soil sample, performing a sieve analysis, calculating the percent passing for each sieve size, and plotting the gradation curve on a semi-logarithmic graph. The resulting gradation curve can be used to classify the soil and determine its engineering properties, which is essential for various geotechnical and construction applications.
Calculation Preview
Full download access to any calculation is available to users with a paid or awarded subscription (XLC Pro).
Subscriptions are free to contributors to the site, alternatively they can be purchased.
Click here for information on subscriptions.