Weibull Slope for Fatigue Statistical Analysis

Description
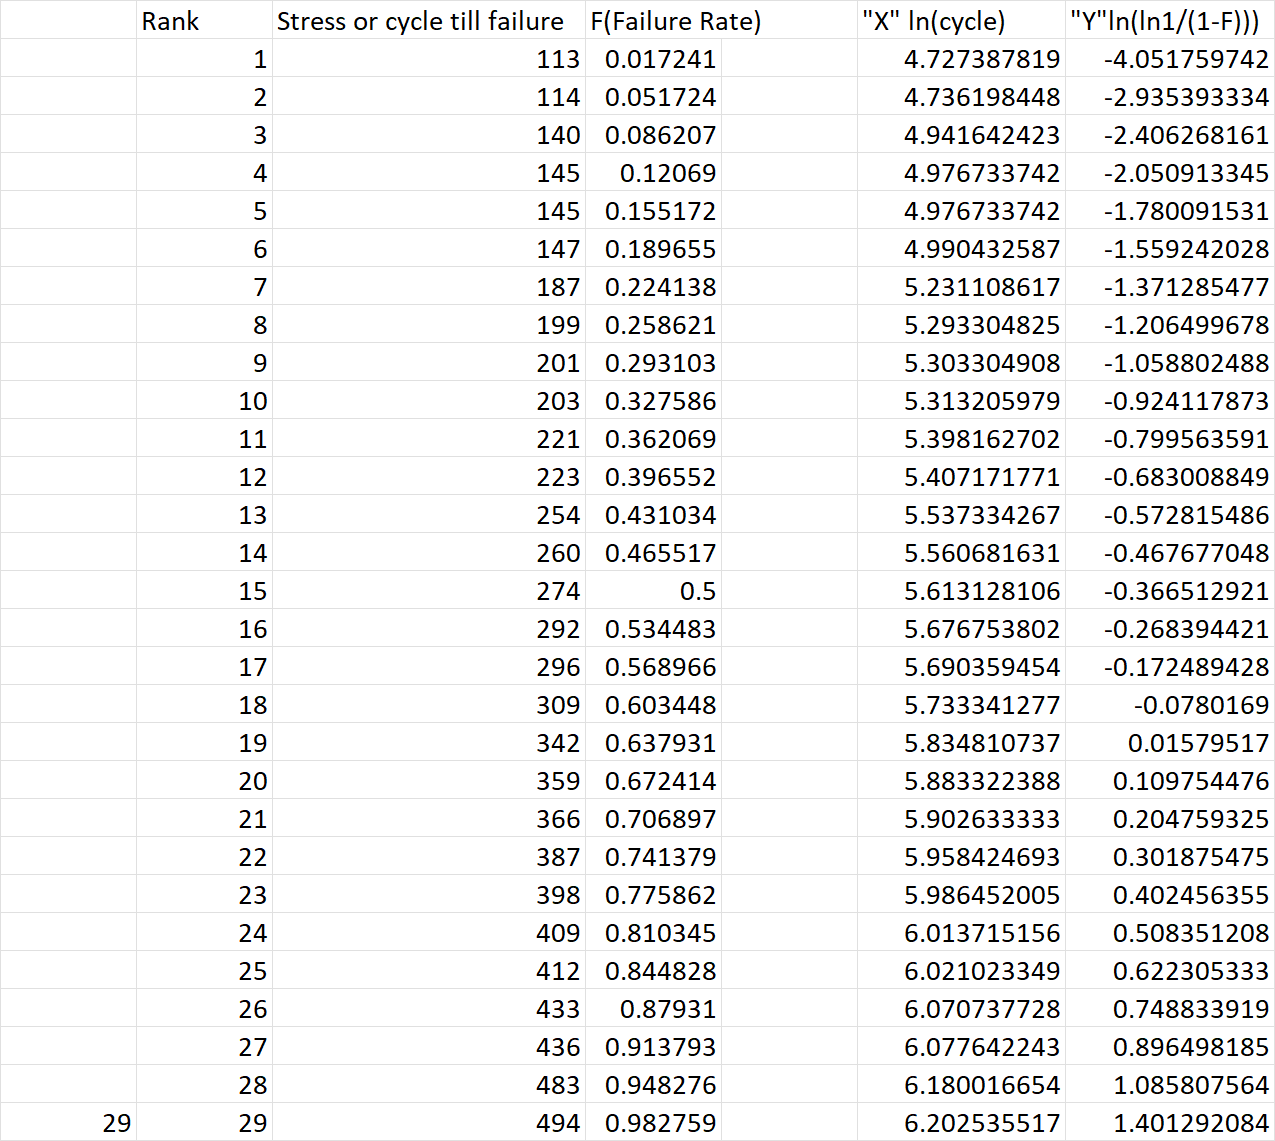
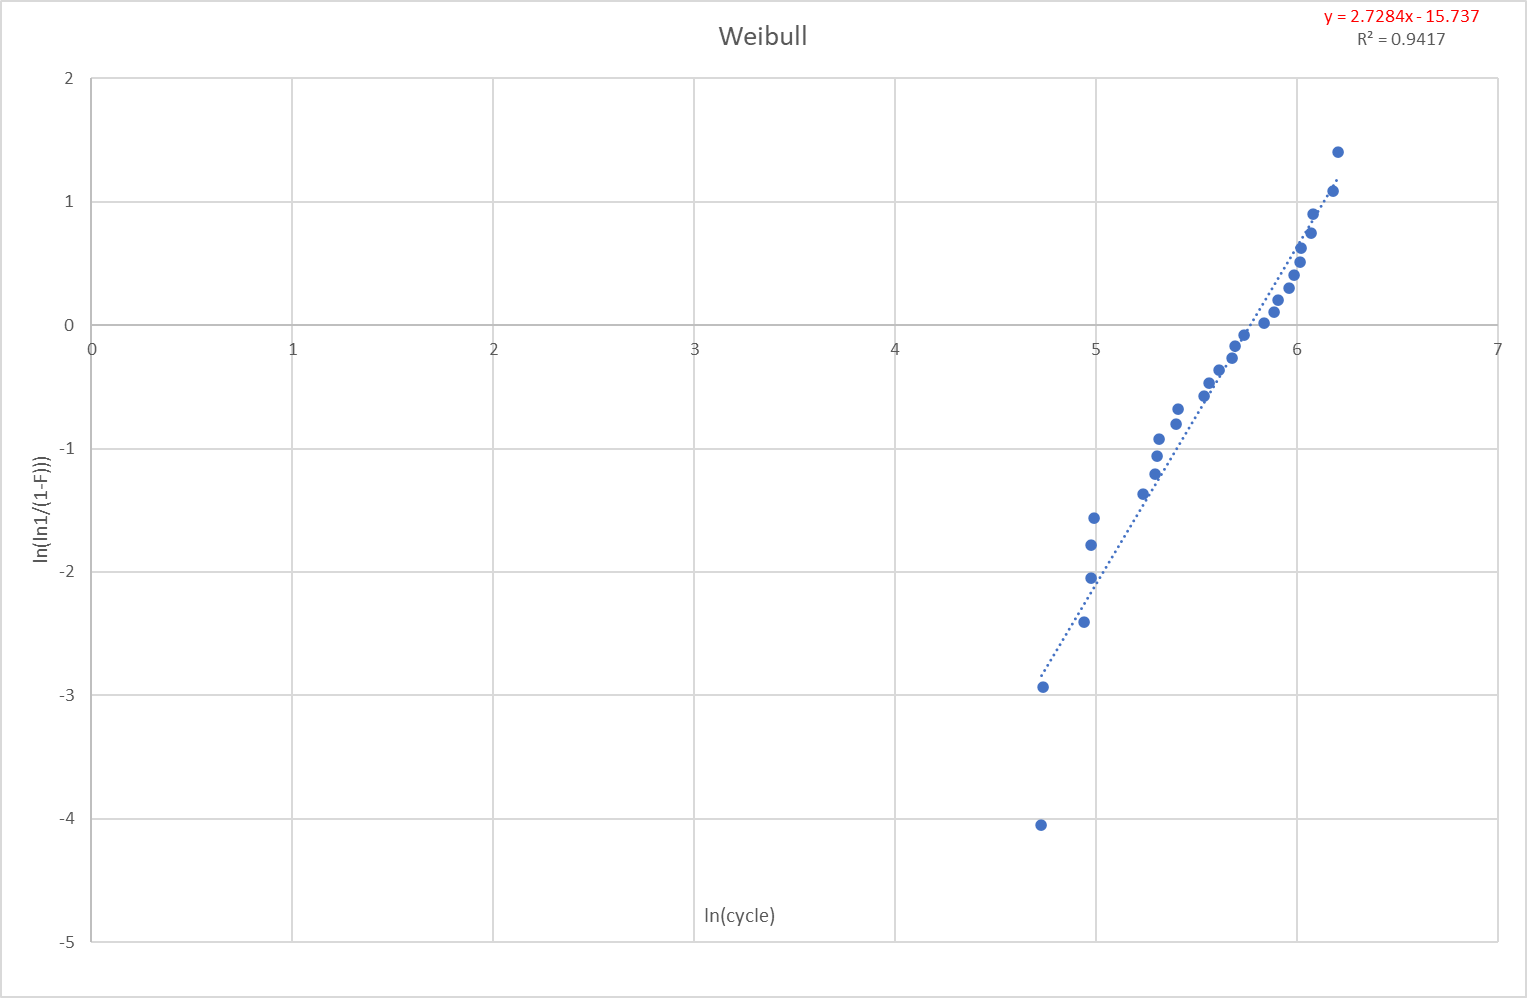
To the Weibull slope for fatigue data. You can use the equation from the linear regression(trendline) to predict cycles to failure, strain to failure, and stress to failure depending on what you are analysing.
Also, you can use that data to the survival probability.
Weibull fatigue assessment is a statistical approach used to analyse and predict the fatigue life of materials under cyclic loading conditions. It's named after Wallodi Weibull who introduced the method.
The Weibull distribution is a probability distribution that is particularly suited to representing the life of materials and components. It can be used to model a wide range of behaviour, from materials that fail quickly (indicating a manufacturing defect or other problem) to materials that have a predictable average life, to materials that have some components that last significantly longer than average.
In the context of fatigue assessment, the Weibull distribution can be used to analyse the results of fatigue tests on a sample of components or materials. By fitting a Weibull distribution to the observed failure times, you can estimate the probability of failure at any given time, which can be used to predict the fatigue life of the material or component.
The Weibull distribution is characterized by two parameters:
-
The shape parameter (?): This parameter determines the shape of the distribution. A ? less than 1 indicates that the failure rate decreases over time (indicating early failures), a ? equal to 1 indicates a constant failure rate (indicating random failures), and a ? greater than 1 indicates that the failure rate increases over time (indicating wear-out failures).
-
The scale parameter (?): This parameter determines the scale of the distribution. It can be thought of as an indication of the average life of the components or materials.
By analysing the fatigue data and fitting a Weibull distribution, engineers can make informed decisions about the suitability of a material or component for a particular application, and predict when maintenance or replacement might be necessary.
Calculation Preview
Full download access to any calculation is available to users with a paid or awarded subscription (XLC Pro).
Subscriptions are free to contributors to the site, alternatively they can be purchased.
Click here for information on subscriptions.