Langrange Interpolation
Description
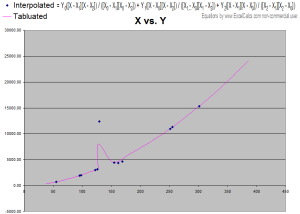
This sheet is an implementation of the second order Lagrange Interpolating Polynomial. Enter your table of data in columns Xi and Yi, Enter the X points you need to interpolate and your Y's are calculated. All points are plotted on a chart.
This spreadsheet will perform a Second order Lagrange interpolation of given data points.
The worksheet "Second Order" is protected without a password.
If the sheet is unlocked then the number of known data points is limited only by Excel and your patience for entering data.
The number of interpolated points is limited to 50 unless you unlock the sheet and copy the formulae.
The chart is plotting from named ranges thus an error is given if all the points are deleted from known or unknown columns. Just click OK and carry on.
The data provided is fabricated to include an obvious anomaly. Graphing the data helps to identify some problems with data.
The interpolation of each point is based on X falling between X0 and X1. This is due to the nature of the lookup function used to choose X0, X1 and X2.
There is no VBA code or special functions. This sheet works in the most rigorously restricted environments (ie network security/anti viral).
I reserve no copyright on this material and express no warranty to its effectiveness.
The Lagrange methods of interpolation are well known and anyone using these methods should have an understanding of the pitfalls.
Calculation Reference
Lagrange interpolation
Calculation Preview
Full download access to any calculation is available to users with a paid or awarded subscription (XLC Pro).
Subscriptions are free to contributors to the site, alternatively they can be purchased.
Click here for information on subscriptions.