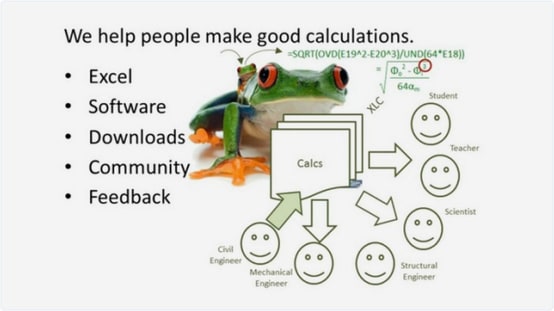
Helping You Make and Share Calculations with MS Excel
ExcelCalcs is a community who share an interest in making calculations with MS Excel. Use our XLC add-in for Excel to display cell formulas as easily readable mathematical equations. Downloading worked solutions from our Repository gives you a head start in solving technical problems. We charge members an annual subscription fee, we offer 50% discounts to academic members, we award free subscriptions to contributors and we offer free trials for the curious. See our subscription plans...
 Our Excel addin software displays cell formulae as mathematical equations. This innovative cell formula verification tool turns Excel into an engineer's calculation pad. It is essential for all engineers, teachers and students. It works with Excel 2000, 2003, 2007, 2010, 2013 and 2016.Download XLC...
 Our Calcs are template Excel solutions covering many subjects including Strength, Beams, Buckling, Civil Engineering, Cracks, Finite Element, Frames, Materials, Plates, Stress Concentration, Structural Details, Torsion, Pressure Vessels, Machine Design, Bolts and Threads, Gears, Pins and Joints, Ropes and Cables, Shafts, Welds, Math, Geometry, Heat Transfer (Conduction, Convection, Radiation & Combined), Dynamics, Fluids Mechanics, Piping, Electricity and Finance. Browse our calcs...
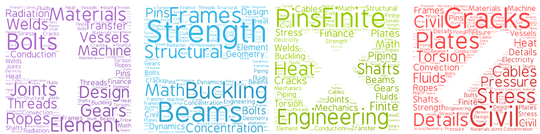
Increase Productivity
- Builds on existing Excel skills
- Use Excel files to distribute knowledge widely
- Fast learning curve compared to other Maths software
- Reuse of Repository items
- Access to expert knowledge via comments feature
Reduce Errors
- Double check cell formulae with mathematical equations
- Check directly against the textbook
- Learn quickly by example
- Reduce rework
- Quality assurance through comments feature
Great Value
- Low cost & higher return on your existing Excel software
- Insignificant cost when compared with MathCAD, Mathematica or Maple
- Free XLC Pro subscriptions to contributors
- Volume discount incentives
- Anyone can view our calculations pages for inspiration
- Free subscriptions for contributors!
- Free trial of XLC add-in and trial downloads
- $99 for a 12 month professional subscription and full site access
- 50% discount for students and teachers!
Consultancy
- Engineering consultants
- Finite Element Analysis
- Strain gauge testing
- World renowned client list
- Provided services since 1995
Training
- Select training modules
- 1 to 5 days duration
- In-house any location
- Spreadsheets design tools
- Free XLC Pro subscriptions
Software
- Excel Addins
- Custom spreadsheets
- Proven track record
- Fixed price contracts
- Support
Recommendations
"This standalone tool makes generation of equations directly from cell formulae’s in the smartest and fastest way." Freedownloadscentre Editor's review.
"With this add-in, you can finally turn those cryptic Excel formulas into recognizable mathematical equations." Vertex42 Five Star Review
"an addin that displays excel formulas symbolically for easy checking and for presentation. Displaying formulas is a real kick!" Eng-Tips Forum Five Star tip.
"I've had a play with it and it's great, it's driven me nuts for years having to do all my equations in equation editor and then update them when things change". Institute of Mechanical Engineers Forum Administrator
"The best thing about XLC is that equations are a really great check on the cell formula. It's easy to make a mistake with Excel formulas (as I know because I make them all the time) but its easy to see where you have gone wrong when you check against equations." Debbie_Williams."I have only been using it for a week or so but XLC is an answer to my prayers. I had been using the MS equation editor which took hours of my time and I often mistyped. Now I can generate equations directly from cell formulas instantaneously. Great idea. Thanks again and well done." Helen_Miller.
"I think I will be ditching MathCAD and using this instead. Then I can send my calculations to anyone, we all have Excel whereas only a few of us have MathCAD." Boffin.
"There are loads of useful web calculations on the internet but the ExcelCalcs Repository gives it to me in an Excel format so I can easily copy and integrate them into my own calculations. This afternoon you saved me hours by downloading a repository calculation rather than authoring my own - thank you!" Mark_Rawlings.
"What a great plug-in I have been looking for something like this for years. Highly recommended!" jhardy.
Latest Calcs
| Uploaded | Details | |
| Uploaded 2025 Jul. 02 |
|
New! AISC H3 Members Subject to Torsion and Combined Torsion, Flexure, Shear, And/Or Axial Force by mepawn. |
| Uploaded 2025 Jul. 02 |
|
New! AISC J10.2 through J10.5 Local Web Effects for Compressive Concentrated Forces by mepawn. |
| Uploaded 2025 Jul. 02 |
|
New! AISC J4 - Elements of Members and Connecting Elements by mepawn. |
| Uploaded 2025 Jul. 01 |
|
New! Crane End Stop Weld by mepawn35. |
| Uploaded 2025 Jul. 01 |
|
New! Beam Flange Stresses by mepawn. |
| Uploaded 2025 Jun. 19 |
|
New! Thickness calculation for bottom plate of a Rectangular Tank subjected to hydrofill pressure by fahim_1161. |
| Uploaded 2025 Jun. 17 |
|
New! Beam Capacity Checking by jj4321. |
Top 10 Authors
| 1 | John Doyle | United Kingdom |
| 2 | Alex Tomanovich | United States |
| 3 | Turan Babacan | Turkey |
| 4 | Conrad Harrison | Australia |
| 5 | Stuart Gaunt | United Kingdom |
| 6 | David Levy | United States |
| 7 | Mohamed Abu Shady | Egypt |
| 8 | SIDDHANATHABOOBATHI | United Arab Emirates |
| 9 | Shaiq Khan | United Kingdom |
| 10 | Mike Jones | United States |